ike
A k9s-style terminal UI for Datadog. Triage alerts, read logs, chase traces and watch spend from your keyboard, across every one of your orgs at once.
Named after a dog named Ike. The command is ike; the job is keeping an eye on things.
brew install cesarsk/tap/ike# macOS and Linuxike --demo# try the whole thing offline, no credentials
ike ❯ in motion
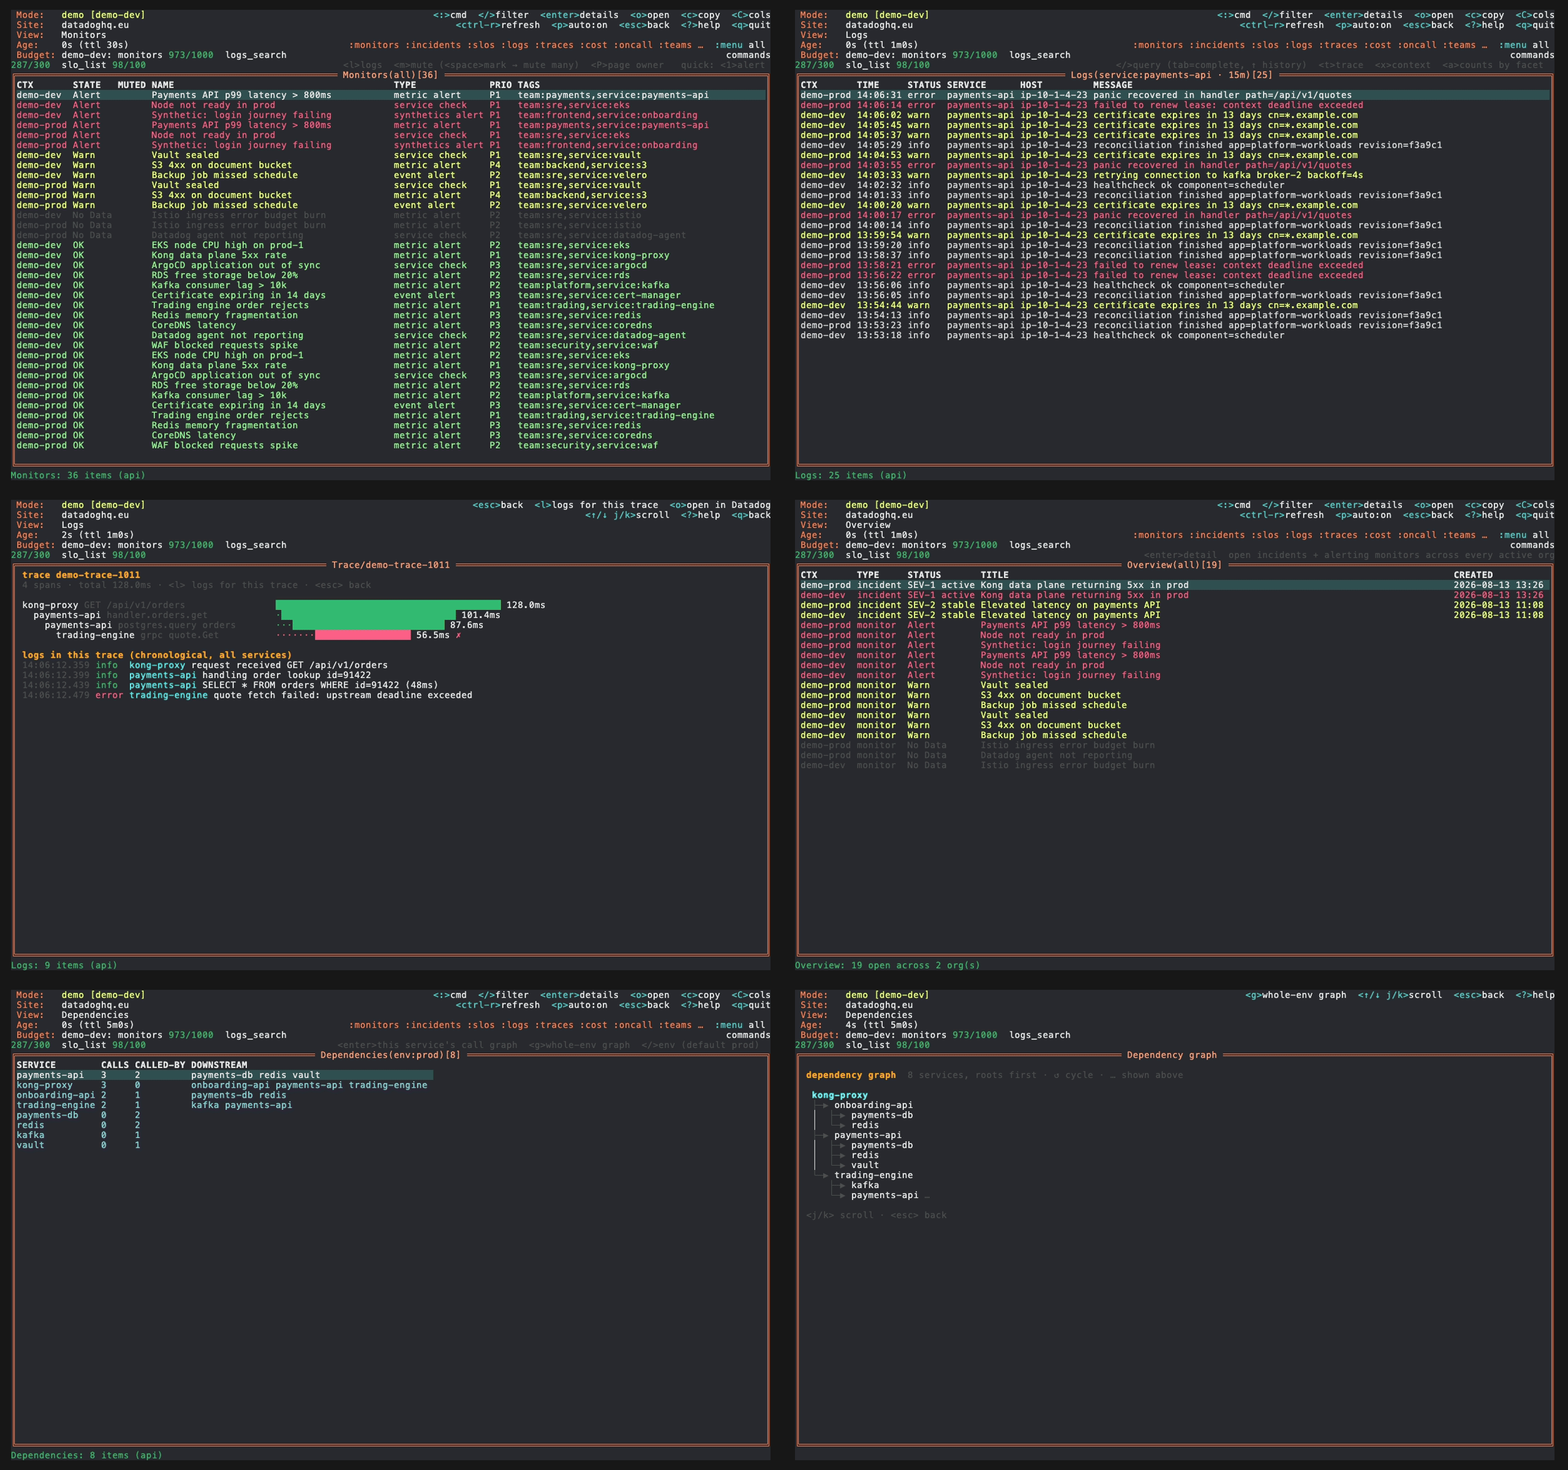
ike ❯ why not the browser
Datadog puts each org behind its own URL, so comparing dev, stage and prod means three tabs and three logins. Activate several contexts and a single monitors view spans all of them, with a CTX column saying where each row came from. The browser cannot do this.
Press l on a firing monitor for that service's logs. Press t on a log line for the distributed trace it belongs to. Press P to page the owning team, after it tells you who that wakes up.
The same muscle memory as k9s: : for views through a Spotlight-style palette, / to filter, enter to drill in, esc to go back.
The cost view is your Datadog spend: this month estimated and projected, twelve months of history with anomaly flags, per product or per sub-org.
ike ❯ 22 views
ike ❯ keys
| : | command palette, type to filter every view |
| / | filter rows, with autocomplete in every view |
| enter | drill in: detail, widget grid, error budget, call graph |
| l · t · x | logs for this row · its trace · surrounding log context |
| space | mark rows, then act on all of them at once |
| esc | back, k9s style: clears the filter first, then pops the stack |
ike ❯ honest limits
Read-mostly on purpose. Every write is confirm-gated and there is no config editing, so ike cannot silently change your monitors or dashboards. Rate limits are a design constraint, not an afterthought: the header shows your remaining API budget per endpoint family, live.